Several approaches and tools exist for measuring website performance. However, the basic premise remains: use a tool to analyze critical metrics and make the necessary site changes to optimize them further.
This article explores various metrics and tools. We also discuss how to read the different reports the tools generate and optimize the user experience further.
Summary of key website performance measurement concepts
| Approach | Description |
|---|---|
| Metrics | Quantitative measurements that assess the speed, responsiveness, and overall user experience of a website. |
| Lighthouse performance score | A score between 0-100 that integrates five different performance metrics |
| Waterfall chart | Gives an overview of the loading sequence of assets along with the time taken by each. Reports on several metrics as a line chart by time. |
| Filmstrip view | Frame-by-frame view of the order in which a user views the website, providing context to many common metrics. |
| Comparative view | Shows side-by-side comparison reports of two different site tests to view change impact or compare different websites. |
How to measure website performance—overview
Before discussing the methods of measuring website performance, let’s consider what you should measure.
Metrics that measure website performance
We have a detailed article on metrics in this guide. We present a summary of common metrics in the table below.
| Metric | What it measures | Meaning |
|---|---|---|
| Time to First Byte(TTFB) | The time it takes for a user's browser to receive the first data byte from your server after it makes a request. | A low TTFB indicates a fast server response time and a better user experience. Ideally, TTFB should be under 800 ms. |
| Time to Start Render(TTSR | The time it takes for the first visual edit to appear on the screen after a page begins to load. | This metric gives an idea of when a user can start seeing the content on the page—a factor that affects their perception of website quality. |
| Speed index | Measures how quickly the content of a page is visibly displayed during load time. | A lower speed Index means the page content appears faster, leading to a better user experience. |
| First Contentful Paint (FCP) | Marks when the first piece of content is rendered on the screen. This could be text, an image, or any other visible element. | It signals to users that the page is starting to load, reducing the perception of waiting. A good FCP score is generally under 1.8 seconds. |
| Largest Contentful Paint (LCP) | Measures the time it takes for the largest visible content element (e.g., an image or large block of text) to load on the screen. | It indicates when the page's main content has loaded. A good LCP score is generally under 2.5 seconds. |
| Fully Loaded Time | The time it takes for all page resources (including images, scripts, and third-party content) to completely load. | This metric reflects the total load time but is less critical for user perception since many users interact with the page before it's fully loaded. |
| First Interactive | Measures when a page is minimally interactive—meaning the user can interact with the page, but not necessarily without delay. | This metric is important for understanding when users can start interacting with the page without major delays. |
| Interaction to Next Paint | Measures the time it takes for the browser to provide feedback on user interaction. | A lower INP is better as it indicates a more responsive page. |
| Cumulative Layout Shift (CLS) | Measures the sum of all unexpected layout shifts that occur during the entire lifespan of the page. | A layout shift occurs when a visible element changes its position from one rendered frame to the next. A low CLS score indicates that content is stable as it loads, reducing the chances of users accidentally clicking on something unintended. |
Tools for measuring website performance
Google PageSpeed Insights is a free tool for assessing web performance. It primarily reports in Core Web Vitals and reports your site performance as poor, needs improvement, or good. It also provides speed improvement suggestions for mobile and desktop web page versions.
WebPageTest is another tool that provides more comprehensive reporting beyond the Core Web Vitals. Tests are conducted from various global locations and real browsers. The free tier offers powerful visualizations like waterfall charts and film strips (explained in the next section).
The pro version lets you measure your carbon footprint. You can also conduct experiments—make changes and observe performance impact without making changes to your actual website. This feature can significantly reduce website development time and effort. You also get API access to integrate the tool into developer workflows.
Reading your website performance measurement results
Tools like WebPageTest report your performance metrics using different scores and charts. We describe some common methods below.
Lighthouse scores
Lighthouse is an open-source Chrome developer tool for basic performance analysis. Different tools integrate Lighthouse and use the same scoring method to measure performance.
Lighthouse assigns a score between 0 to 100 across five different categories:
- Performance assesses your FCP, LCP, Speed Index, CLS, time to interactive, and total blocking time.
- Accessibility assesses various website design elements based on the axe user impact assessments like accessible buttons, color contrast ratio, etc.
- Best practices assess whether your website implements different best practices, such as a valid doctype declaration, optimized images, and suitable page titles.
- SEO checks for SEO best practices like crawlable links, valid robots.txt, and meta descriptions.
- Progressive Web Apps (PWA) checks for mobile optimization, HTTPS security, and other modern features.


You can conduct Lighthouse performance tests with various device configurations. The default settings for mobile and desktop differ in more than just screen size or the user agent used for device identification. You can choose different device configurations to influence other elements of the test environment.
- Network latency: how long does data travel between the client and the server take?
- Network bandwidth: how much data can be exchanged between client and server per second?
- CPU speed: how quickly can the browser run code or perform tasks like rendering page content?
You can limit network speed to the parameters specified in the test configuration when conducted on a PC with a fast internet connection. Lighthouse's mobile scores and metrics are significantly lower since the simulated test environment is significantly slower on mobile.
So how is the performance score in a Lighthouse test actually calculated? We summarize in the table below.
| Metric | Score contribution | What it measures |
|---|---|---|
| Total Blocking Time | 30% | Could a large amount of CPU processing on the page lead to slow user interactions? |
| Largest Contentful Paint | 25% | How quickly does the main page content show up? |
| Cumulative Layout Shift | 25% | Does page content move around after appearing and disorient the user? |
| First Contentful Paint | 10% | How quickly does the first bit of page content show up? |
| Speed Index | 10% | How long does it take for most of the page content to appear? |
Waterfall charts
Waterfall charts map out all the resources on your web page, organizing content by how long it takes to load and when it loads.
Is JavaScript slowing down your site speed? Are your large images consuming all of your bandwidth? You also want to check if your resources are being correctly cached and their impact on page performance. That’s where waterfall charts come in handy.
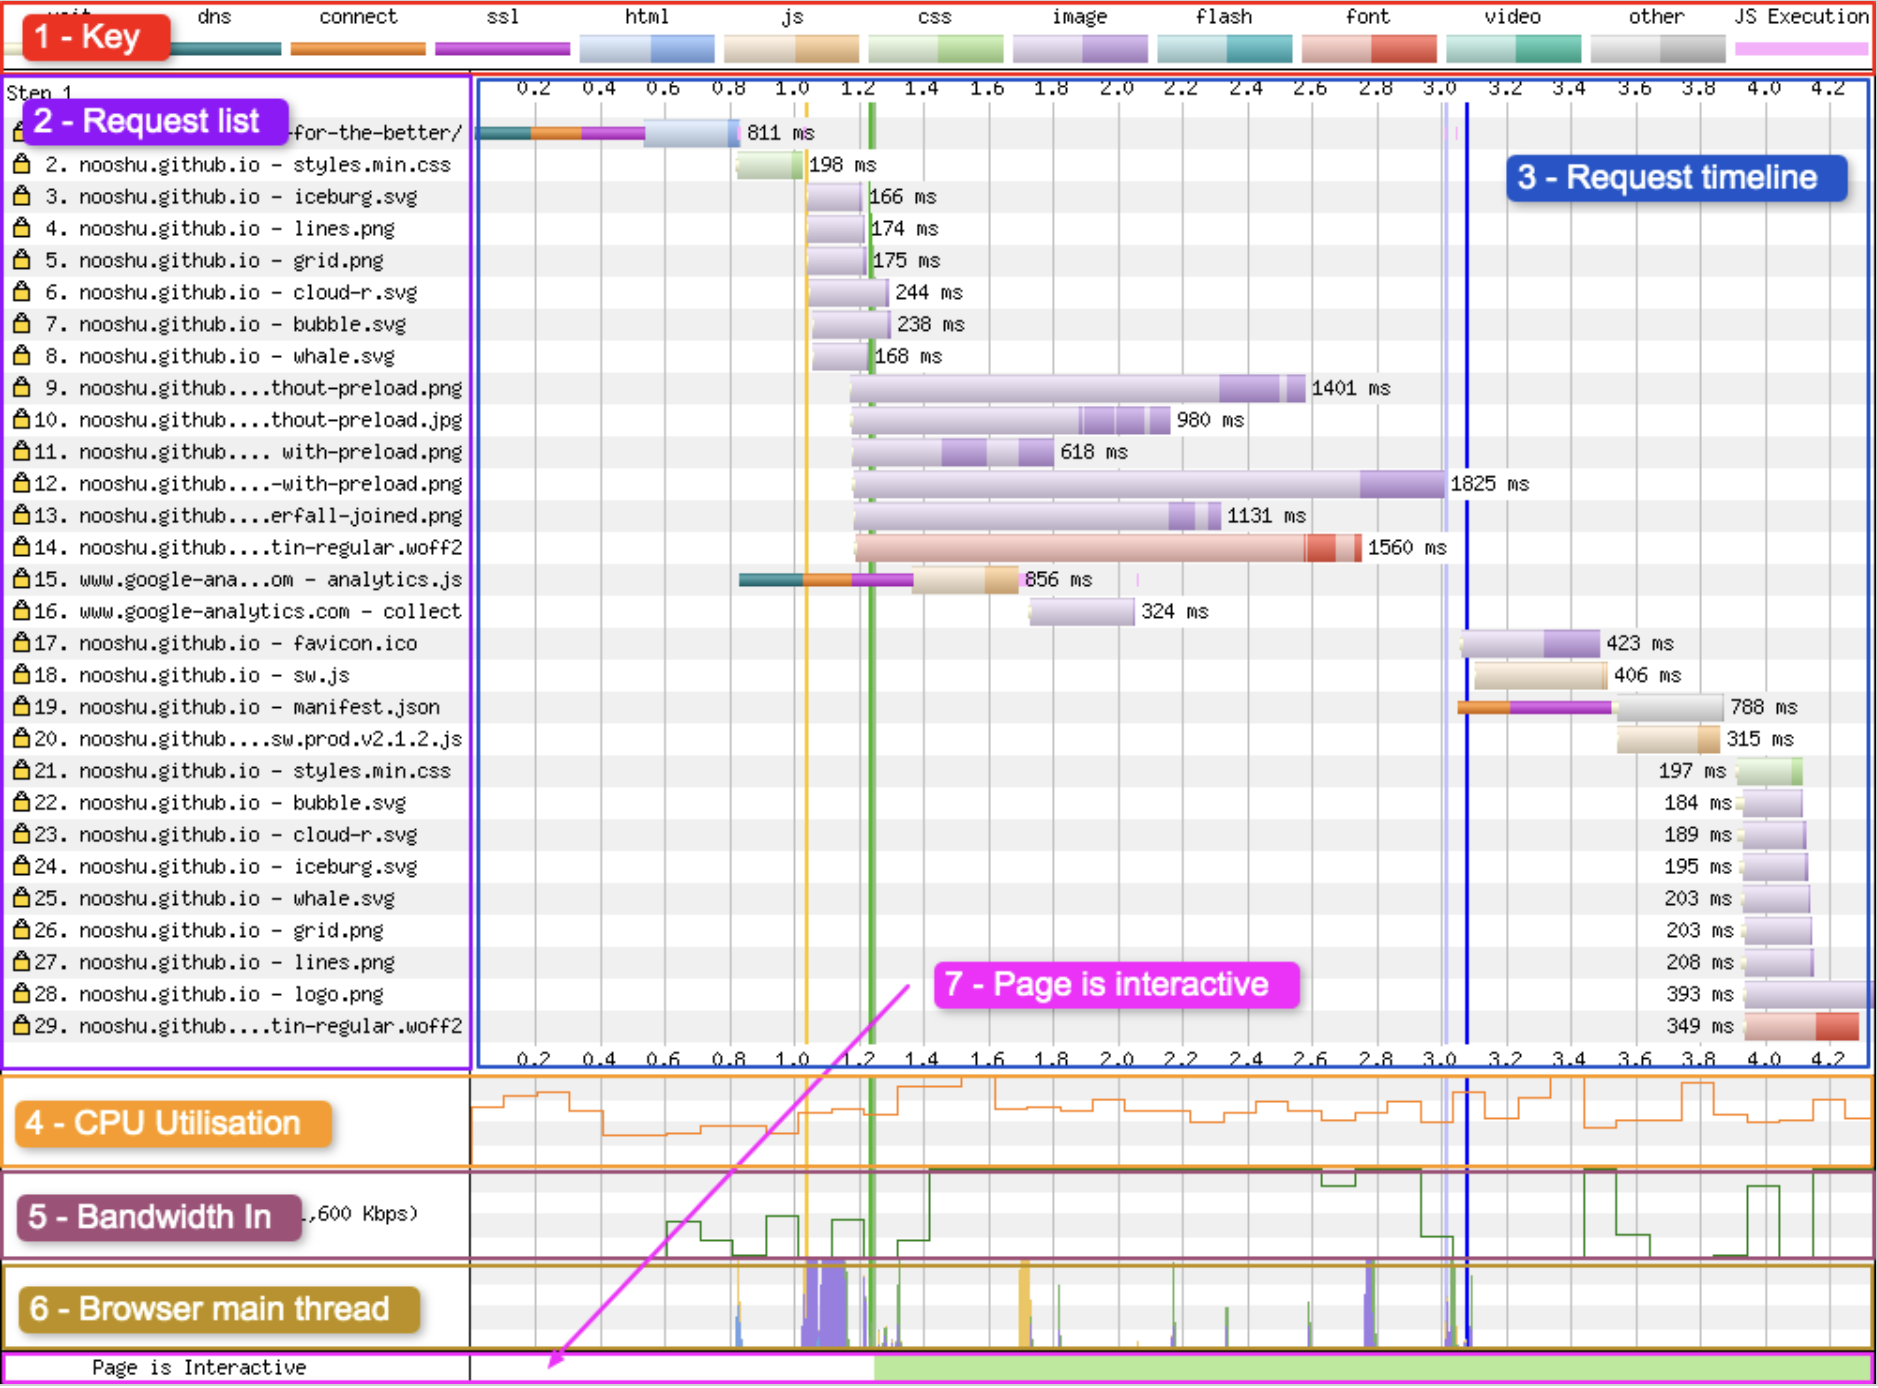
Important elements in a waterfall chart are:
Key
The key shows three information types,
- Information about the connection status (DNS lookup, connection established)
- The requested resource type (e.g., HTML, images, etc.)
- Miscellaneous events (wait, JavaScript execution)
The moment at which the user’s browser requested the resource is indicated by the light shade. The dark shade indicates the actual download point of the resource.
Request list
A list of resources the browser identifies on a webpage, along with the sequence in which they were requested. The request number is displayed on the left, and a yellow lock icon indicates whether the request is made through a secure connection (HTTPS).
Request timeline
The timeline displays time on the horizontal (x) axis and each request made on the vertical (y) axis. It includes the discovery (wait) phase, the moment requests are sent, and the eventual downloading of resources.
CPU utilization
It displays the CPU usage of the current webpage at any given time, ranging from 0 to 100%.
Bandwidth In
This serves as a signal for when data enters the browser. You can use the visualization to quickly observe when the browser is wasting time and when it is working productively. Since the absolute scale isn't particularly precise, it might be disregarded.
Browser Main Thread
This graph visualizes what the browser's main thread is doing at any specific point in time (x-axis). The y-axis shows the percentage from 0 - 100%.
Page is Interactive
This graph gives you an indication of when the main thread is blocked.
Vertical lines
You can see the key for each of the colored vertical lines below the “Waterfall View” header as seen below:

The table below summarizes the meanings of the different colored lines in the chart.
| Line colour | Metric | Description |
|---|---|---|
| Green | Start Render | Marks the first moment when a user sees any pixels rendered on the page. These pixels might come from various elements, like background colors or borders, and don’t necessarily include actual content. Until this point, the screen remains completely blank. |
| Light green | First Contentful Paint | The point where the browser renders anything to the screen that is visually different from before navigation. |
| Dark green- dashed | Largest Contentful Paint | Provides the render time of the largest visible picture or text block within the viewport as of the moment the website first loaded. |
| Orange dashed | Layout Shift | Every unexpected layout shift detected by the test. When a layout change occurs without the user's interaction (such as pressing a button), it is called an unexpected shift. |
| Yellow | DOM Interactive | The point at which the browser has finished parsing all the HTML and DOM construction is complete. Unfortunately, it’s not a reliable metric. |
| Pink | DOM Content Loaded | The point at which the HTML has been loaded and parsed, and the browser has reached the end of the document. All blocking scripts have been loaded and run. At this point, the DOM is completely defined. |
| Lavender | On Load | The point at which the window load event fires. All objects are in the DOM, and all images and scripts have finished loading. Note the thickness of this line in the key. This is to indicate that this line covers a duration rather than a single point of time in the waterfall. |
| Blue | Document Complete | The point where the on-load event has fired and all the static image content has loaded. Content changes that are triggered by JavaScript execution may not be included. |
Filmstrip View
Lighthouse scores and waterfall charts show how your website performs behind the scenes. However, user perception is a key aspect of web performance that is difficult to understand from numbers alone. You want to measure what the user “feels” during a page load, but web pages load too quickly for our eyes to break down the process into discrete steps.
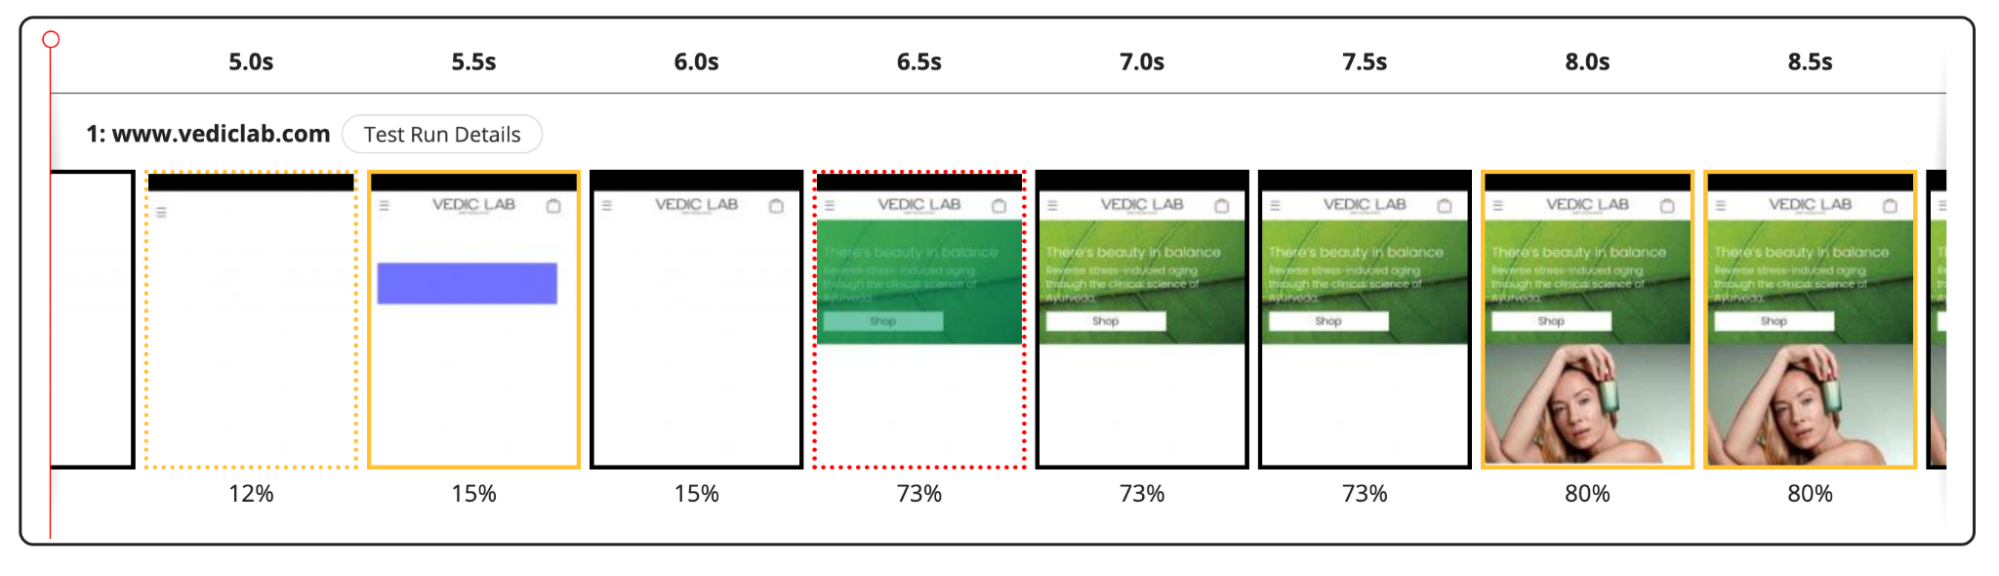
That’s where the filmstrip view comes in. It takes periodic screenshots of page content above the fold and displays each image chronologically. This allows you to visualize how the page unfolds for the user—just like a series of static photos visualizing a galloping horse filmed by Eadweard Muybridge in the year 1878.

The film strip helps you visualize the end-user page load experience. Long runs of unchanging or blank images tell you that the page is too slow. You can also observe when content that is important to the user actually shows up. It thus bridges the gap between context-agnostic metrics and user perception.
You can align the image with places of interest by dragging it left and right. In the example below, the film strip and the page's rendering start point are aligned.
Comparative view
Ultimately, you measure website performance to improve it. This involves gathering insights and implementing the necessary code changes.
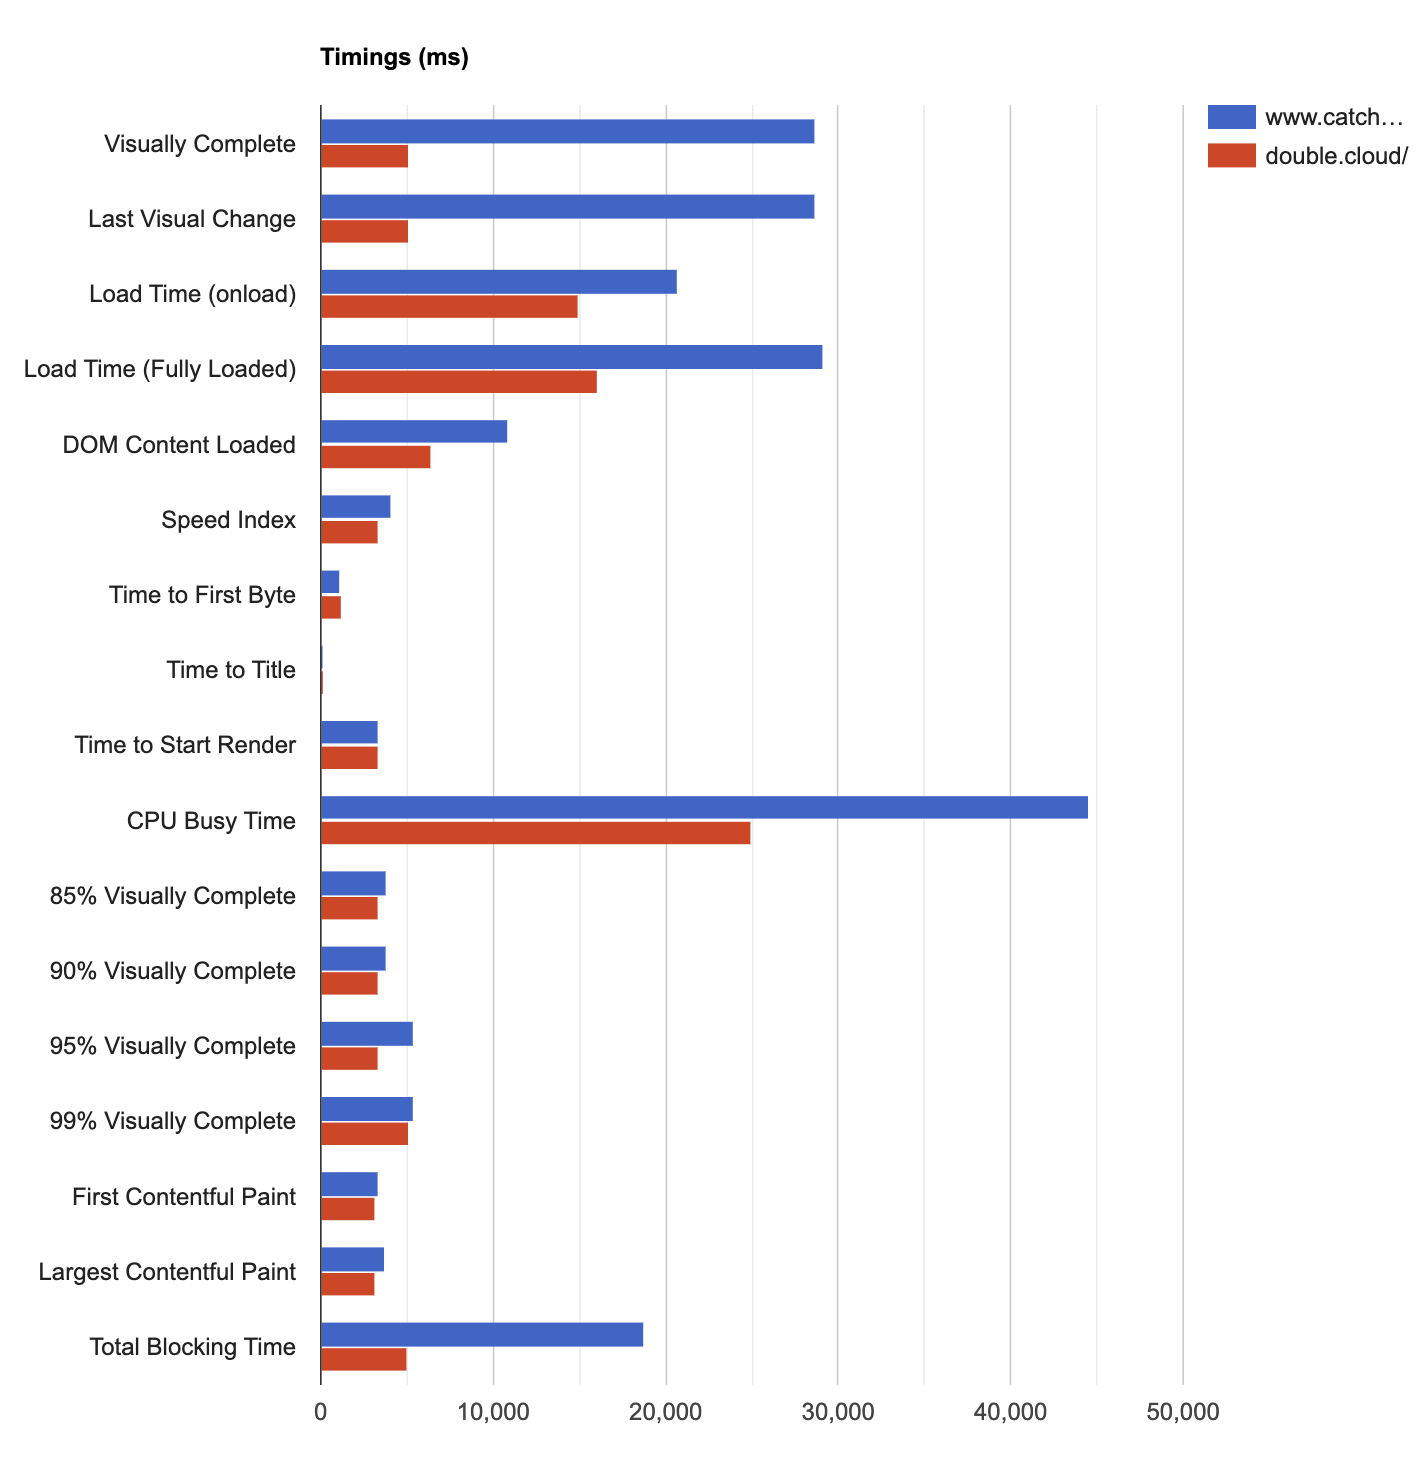
A comparative view shows the performance impact of any changes made. It compares two test runs side-by-side.
For example, in WebPageTest, you can see your recent test runs under the test history tab.

Select the tests you want to compare, and click the “Compare Selected Tests” button. This will take you through a report similar to the filmstrip view discussed above, but in this view, the two results will be side by side. You can visually see the impact of changes made.

The waterfall, graphs, and bar charts are also visible, comparing different metrics side-by-side.
WebPageTest analyzes your website’s performance and provides actionable recommendations for optimization. With WebPageTest Pro, you can take this further by running experiments to test the impact of suggested changes—without making any modifications to your live site. That way, you can try out different changes without impacting your users and only roll out changes that bring the most value to you.
Best practices in website performance measurement
The below best practices will help you ensure accurate, consistent, and meaningful results.
Clear browser cache
Cached files can significantly speed up page load times on subsequent visits, leading to misleading results. Always clear the browser cache or use incognito mode to simulate a first-time visitor experience.
Disable browser extensions
Browser extensions can affect page load times by adding extra scripts or altering how pages are rendered. Disable them to avoid skewing the performance data.
Test from multiple systems
Different devices and browsers can have varying performance characteristics. Test on various devices (desktop, tablet, mobile) and browsers (Chrome, Firefox, Safari) to comprehensively understand your site’s performance.
Analyze all site versions
Mobile and desktop versions of a site can behave differently due to varying screen sizes, network conditions, and content delivery strategies. Ensure both versions are optimized and tested separately.
Consider user location
Geographic location affects latency and load times due to the distance from servers or content delivery network (CDN) endpoints. Test from locations representative of your user base to understand regional performance differences.
Test critical pages
Focus on pages critical to user experience, such as the homepage, product pages, checkout processes, or landing pages. These are often the most visited and impact user satisfaction the most.
Document test scenarios
Consistent documentation of the scenarios being tested (e.g., specific user flows, page elements, or dynamic content) helps compare results over time and understand what specific changes may impact performance.
Go beyond core web vitals
WebPageTest is a powerful tool for detailed performance insights, but it's just one component of Catchpoint’s comprehensive monitoring platform. You should complement synthetic testing with Catchpoint Real User Monitoring (RUM) to gain real-time insights into user behavior and experience, ensuring a complete view of your website's performance.
In addition, Catchpoint’s Internet Performance Monitoring (IPM) platform has the largest observability network in the industry, with over 2734 vantage points worldwide. This extensive coverage allows you to measure user experience across critical locations and service providers, empowering you to detect and resolve performance issues before they affect your users.
For example, performance issues could be related to third parties in your internet stack, such as DNS, APIs, or third-party services. Catchpoint’s Internet Performance Monitoring (IPM) solution helps you avoid blindspots and include them in your website performance analysis.
Last thoughts
A high-performing website is a key asset that boosts your online success. How to measure website performance? Use WebPageTest—a comprehensive tool that gives you raw metric data and user experience context. That way, you can assess and improve the most important metrics for your end users. In-tool experiments let you try out different changes without actually rolling them out to production.