Your employees working remotely or from satellite offices lose productivity due to technology friction, such as issues with desktop configuration, VPN access, DNS lookup, WiFi delay, API latency, or problems with third-party application providers.
Traditional IT monitoring tools don’t monitor these components on the transaction path between remote end-users and systems at the company's data centers, so they continue to report full system health. The gap between these perspectives costs enterprises billions annually in lost productivity, yet most organizations lack the tools to identify where this friction occurs.
Digital employee experience (DEX) monitoring addresses this gap by measuring end-users' experiences rather than the health of application servers and corporate networks. The solution layers user experience scoring on top of traditional monitoring, creating a unified view that connects system performance to user impact.
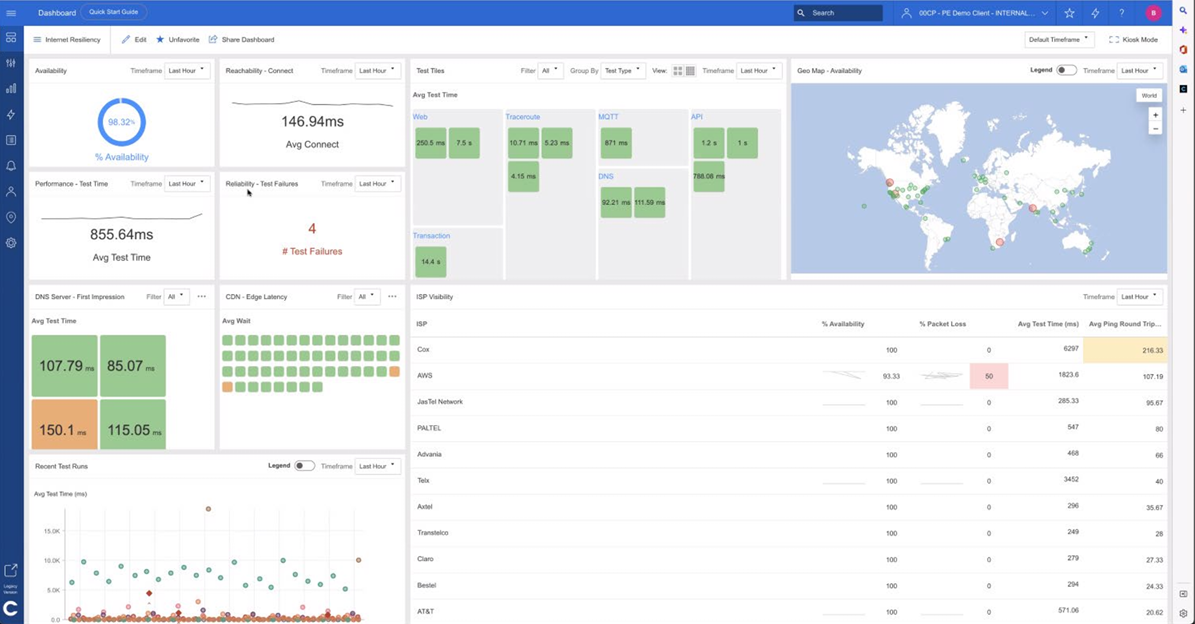
For example, the dashboard below shows an overall user experience score comprised of three scores at the top right-hand of the screen:
- Device health, such as the end-user computers
- Network quality, which includes the public internet and users’ WiFi networks,
- Application performance, which includes third-party SaaS applications.
The section below the health scores shows the root cause problems contributing to the lower score, such as desktop configuration or VPN latency. This unified view is designed to monitor the employee experiences and the factors contributing to their potential degradation.

This article explores how digital employee experience health scoring operates in practice, why it surpasses traditional monitoring, and how technical teams can effectively implement digital employee monitoring to align metrics with reality.
Summary of key digital employee experience health scoring concepts
Capturing application metrics for productivity impact analysis
Employee frustration is experienced at the application layer. Yet, most monitoring mechanisms stop at the infrastructure layer.
Application layer metrics for employee experience scoring should focus on how an application affects an employee's ability to do their job, despite the monitoring dashboard showing "all systems normal."
The following are some of the most meaningful aspects that directly correlate an application's performance with digital employee experience and productivity.
Frontend performance measurement
Effective frontend measurement requires tracking specific interaction patterns:
Frontend delays operate on a different scale than backend performance. A Google study indicates that 53% of users abandon tasks when interfaces take more than 3 seconds to respond. While enterprise users can't immediately abandon the interface due to their dependency on the tool, they eventually develop negative associations with the tool.
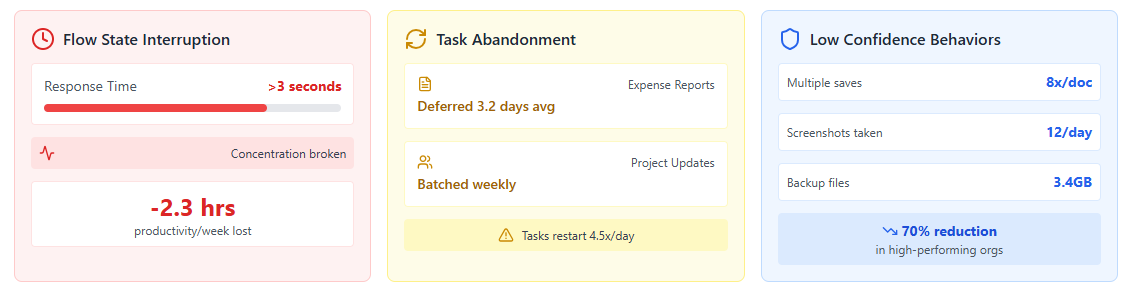
The screenshot below illustrates the typical impacts of workflow interruptions on employee experience. The application user interface response time shown on the left contributes to users abandoning sessions (middle section), and an increase in behavior that reflects low confidence in the application, such as users saving their documents multiple times due to slow UI response.
API performance monitoring
When frontend monitoring flags an issue (e.g., "login page is slow"), the next step is to investigate the underlying API calls to identify the components contributing to the high latency. Modern applications make an average of 30-50 API calls for common operations to paint a user interface. Each call adds latency, and failures cascade in unexpected ways. When scoring employee experience, the key is identifying and monitoring the API chains as critical experience paths behind the most frequent employee tasks.
Consider how your average employee completes a specific set of core tasks daily (updating customer records, logging calls, creating opportunities, etc.). You can map every API involved in these tasks and weigh their performance based on task frequency and business importance. But then, it is equally important to measure API performance from the user's perspective. The authentication API might have an average response time of 50ms, but this average can mask critical data points that lead to frustration.
API monitoring must also account for partial failures. For instance, a document uploads successfully, but the indexing service can still fail. As a result, employees can save files but can't search for them later.
The most valuable API metrics for experience scoring include:
Error tracking and impact quantification
Any application intended for broader use, especially in enterprise-grade setups, will either implicitly generate error data that can be used to derive error rates or it can be explicitly integrated with monitoring systems to calculate and display them as a key performance indicator (KPI). However, error rates may not always provide an accurate representation.
For example, a 0.1% error rate may seem negligible until you realize it affects your thousand-person team during critical hours, when every minute of rework and delayed reporting can result in significant losses.
For actual utility, error classification within experience scoring systems should always focus on the direct impact on employee effectiveness and the broader business context. For reference, understand how this relates to typical JavaScript errors:
- Critical path errors: Preventing core business functions (can't submit timesheet, can't approve invoice)
- Degradation errors: Reducing functionality (advanced search fails, falling back to basic search)
- Cosmetic errors: Visual glitches with no functional impact
Each category demands different response levels. A cosmetic error in the company directory might never warrant attention. On the other hand, a critical path error in the expense system during the travel season requires immediate attention. Such application prioritizations can help translate technical metrics into business costs.
To support this nuanced understanding of impact, session replays can help you capture the whole user journey and what the user was attempting to accomplish when the error occurred. As a result, you can monitor patterns like employees attempting the same action multiple times before giving up, or consistently abandoning workflows at specific error-prone steps.
Measuring network impact through employee device telemetry
While the network path appears straightforward, an employee must navigate through DNS lookups and CDN redirects before actually accessing the application. Most monitoring focuses on the final connection, but a slow DNS resolution adds precious seconds before anything else happens. Similarly, when static content loads from a poorly performing CDN edge, the application would feel sluggish even if the backend is lightning fast.
To truly understand the network's impact on employee experience, you need telemetry from their devices, capturing their experience as they work, whether that's from the desktop of a remote user working from home or a network appliance deployed in a satellite office. Note that we are referring to actual measurements during real-world work, rather than synthetic tests from your data center. The tricky part is normalizing this data when everyone's working from different places with wildly different network conditions.

When employees complain about performance, you must pinpoint where the problem lies. Traceroute data from the employees' locations shows you every hop between them and the applications. This matters for experience scoring because a 200ms delay at hop 3 (likely the ISP) requires different remediation than the same delay at hop 12 (near the application). Without this granularity, your scores indicate something's wrong, but not what to fix.
As network metrics are inherently noisy, the experience scoring mechanism must handle this data intelligently. The real insight comes from correlating these network measurements with application events. Your support team needs to know that the spike in retransmissions happened during a file upload, not at a different time. For appropriate context, select a monitoring tool that can monitor networks, real user experience, and APIs all on one platform.
Instrumenting endpoints for context-aware performance data
Understanding the impact of endpoints (e.g., end users' desktops or mobile devices) requires the same context-aware approach you apply to other types of monitoring. This means you must monitor the metrics and system configuration of endpoint devices.
To understand employee experience, you need agents installed on endpoint devices to monitor system metrics (such as CPU and RAM usage), the processes running on the OS (e.g., the Microsoft Teams application), the activity of network interface cards (NICs), system and application logs, and system configuration settings.
However, data collection must be performed intelligently to avoid system slowdown due to the monitoring overhead that becomes noticeable to the end user. For instance, you may collect detailed metrics during active Microsoft Teams calls but not when the machine is not actively using Teams.
For best results, it is recommended to leverage adaptive sampling to step up data collection for diagnostics only when problems occur (e.g., an application error is logged) and ease off collection frequency during regular operations.
Enterprise-grade experience platforms require an architecture that can scale to thousands of endpoints without being overwhelmed by data. A typical design should layer multiple collection techniques:
- Browser monitoring for web applications to capture timing and errors
- OS-level measurements for monitoring desktop performance
- API monitoring to collect telemetry data from cloud-based application services
The multi-layered approach is necessary because no single technique can monitor all the relevant data.
Using multiple data collection methods for accurate scoring
Modern experience monitoring platforms combine multiple collection approaches. Each collection method timestamps differently, uses different granularity, and may miss events that other methods can detect.
For instance, consider the approach leading platforms take to orchestrate real user monitoring (RUM) and synthetic monitoring data to cover each mechanism's blind spots. Each approach collects fundamentally different data at different times, yet a continuous point of confusion is which one can help you measure "user experience."
RUM captures actual employee experiences through JavaScript injection, browser plugins, or application hooks. It shows precisely what users experience, but only when they're actively working. Implementation requires modifying applications or deploying browser extensions, which security teams often resist.
Conversely, synthetic monitoring runs scripted transactions continuously, catching problems before employees begin using an application. For example, a network or application problem can be detected overnight based on simulated transactions before users log into the applications in the morning.

RUM requires instrumentation across hundreds of applications, but shows real problems. Synthetic monitoring requires only key transaction scripts but may miss edge cases, such as slowdowns when using an application's most advanced features.
Leveraging data correlation and AI for faster resolution
Correlation engines aren't critical if you're evaluating basic monitoring tools; instead, you just need accurate data collection. But correlation capability is a must if you're looking for a solution that improves employee productivity by quickly solving their technical issues.
For context, vanilla monitoring indicates that the CPU is at 90%. A monitoring system that can correlate data across silos using machine learning and artificial intelligence would tell you, "The finance team can't close month-end because their Excel macros are fighting with antivirus scans for CPU resources."

Your chosen monitoring platform should be able to correlate data from entirely different sources that produce reports in different formats. The right platform can not only normalize incompatible data types but also gracefully handle missing data. For example, if the network monitor was offline for 5 minutes, can the platform still correlate endpoint and application issues during that window? In most cases, a probabilistic matching is required rather than requiring perfect data from every source.
More importantly, does your monitoring platform understand which connection matters? The tool should be smart enough to link events that happen within seconds of each other, even when their timestamps don't match perfectly. It should group related events using time windows, like saying, "Anything within 5 seconds is probably connected."
Before choosing a monitoring solution, ask vendors simple questions:
- Can their system connect events that happen seconds apart?
- How does it handle data from systems using different time zones?
- When it identifies a problem, does it provide a single answer or present the most likely causes along with confidence scores?
How Catchpoint has standardized workforce experience scoring
Digital employee experience health is now reasonably easy to measure, even if fixing the underlying issues may be complex. Over the years, Catchpoint has simplified digital experience monitoring by codifying the evaluation criteria into a unified scoring methodology that automatically weighs device performance, network quality, and application responsiveness.
Essentially, you deploy Catchpoint's monitoring across your digital workplace, and it evaluates each component to produce a comprehensive experience score. The platform provides an overall score calculated from three sub-scores—endpoint, network, and application—and identifies exactly which elements are degrading performance.
The standardization mirrors what happened with other monitoring domains. Just as website performance tools established standard metrics like Core Web Vitals, Catchpoint has created a field-proven framework that Fortune 500 companies now use as their single source of truth for employee experience. The score provides IT teams with immediate visibility into experience quality, allowing them to drill down into specific issues affecting productivity.
The real breakthrough is the simplicity. Instead of correlating disparate data sources or relying on employee complaints, teams get one actionable metric that answers the fundamental question: are their employees having a good or bad digital experience right now?
Still unsure of how Catchpoint can help? Book a free trial here.

